
-(1).png)
-(1).png)

Healthcare systems face increasing demands that may negatively impact staff well-being and elevate sick leave rates. Simulation-based team training enhances clinical skills through teamwork and communication training. However, further research is needed to understand its impact on healthcare professionals’ well-being. This study investigates how a simulation-based team training intervention affects sick leave among healthcare professionals.
We conducted a multisite controlled intervention study comparing sick leave rates during a 1-year intervention period (April 2023–April 2024) with the 2 preceding years (April 2021–April 2023). Four paediatric departments implemented an enhanced simulation-based training programme, improving the quality, structure and frequency of simulation activities. The intervention included facilitator training and a workshop, while four control departments continued standard practices. Statistical analyses included t-tests and mixed models using crude and adjusted difference-in-differences approaches, adjusting for staff age, gender and profession.
During the intervention period, 244 simulations were completed in the intervention group versus 84 in the control group. Among all employees, including new hires and those who left during the study period, the adjusted reduction in sick leave during the intervention year compared to the preceding years was −1.0% (95% confidence interval [CI]: −1.8, −0.2) over 2 years and −0.8% (95% CI: −1.7, −0.0) over 1 year. For the stable group, defined as employees continuously employed throughout the study period, the corresponding reductions were −1.1% (95% CI: −1.9, −0.2) and −0.9% (95% CI: −1.8, −0.0), respectively. A 1.0% reduction in sick leave corresponds to 11,858 additional working hours for 700 healthcare professionals during 1 year. Compared to the 1,993 hours spent on training, this represents a return on investment of 5.9 times.
This study examines the impact of simulation-based training on sick leave among healthcare staff. Our findings indicate a reduced sick leave within the intervention group, even after adjusting for staff characteristics. However, baseline differences and the potential for regression towards the mean necessitate cautious interpretation. Despite these limitations, the results suggest that simulation-based team training may reduce sick leave and promote staff well-being. This intervention offers a promising strategy for enhancing the resilience of the healthcare workforce.
What this study adds
•Based on our findings, simulation-based team training appeared to be associated with a reduction in sick leave rates.
•The reduction in sick leave corresponded to 11,858 additional working hours.
•The return on investment was estimated at 5.9 working hours gained per training hour.
•The findings suggest that simulation-based training may enhance staff well-being and resilience.
•This study provides controlled evidence supporting simulation-based training as a workforce sustainability strategy.
Healthcare systems worldwide are under increasing pressure, significantly affecting patient safety and staff well-being [1–3]. Deteriorating working conditions for healthcare professionals, characterized by high psychological demands, long hours, night shifts and physical strain, contribute to increased sick leave and staff turnover [4–8]. These adverse conditions and inadequate staff support often lead to burnout and decreased employee engagement, exacerbating workforce challenges [5,6]. Reducing stress and burnout among healthcare professionals is critical for improving workforce efficiency, patient care and economic sustainability [9–11].
Simulation-based team training is a practical, evidence-based intervention that can enhance teamwork, confidence, and stress-management skills [12]. Using realistic clinical scenarios in controlled settings allows healthcare professionals to practice and refine their teamwork and decision-making skills [13]. Traditionally focused on improving clinical and technical proficiency, simulation training can also enhance self-efficacy – the belief in one’s ability to perform tasks successfully – a key predictor of stress management and job performance [14–16]. Additionally, simulation training can contribute to individual and collective learning, while also supporting communication, leadership, and collaboration within teams [17,18]. These factors may help staff feel more competent and confident in handling challenging situations, improving their ability to manage stress and navigate complex workflows [19]. By reducing perceived stress, improving teamwork and addressing organizational challenges, simulation training may enhance job satisfaction, support staff well-being and contribute to a reduction in sick leave [20].
While the benefits of simulation-based training for technical skills and patient outcomes are well documented, its direct impact on workforce well-being, particularly sick leave, remains insufficiently explored [21–27]. Understanding how simulation influences organizational norms, individual behaviours, team dynamics and self-efficacy is essential for developing interventions that promote well-being and enhance staff retention [28–30].
Few studies have investigated the potential of simulation training to reduce sick leave. For example, Meurling et al. observed a general reduction in sick leave among nurses over time, although no significant difference was found between intervention and control intensive care units (ICUs) [31]. Another study reported that sick leave rates increased in both the intervention and control groups, but the increase was 0.3% lower among healthcare professionals who participated in simulation training compared to the control group [20]. Additionally, a randomized controlled trial by El Khamali et al. involving 198 ICU nurses found that simulation-based training significantly reduced sick leave compared to controls [32].
A systematic review by Weaver et al. identified simulation-based training as a key strategy for improving teamwork, communication and safety culture, all critical for workforce well-being [28]. However, the review also highlighted significant gaps in the existing evidence base, including small sample sizes, heterogeneity in measurement tools and limited follow-up periods. Addressing these limitations will require future research to incorporate large-scale data, controlled study designs, and detailed documentation of training frequency, session content and long-term outcomes to better understand the impact of simulation-based training on workforce well-being, including sick leave.
This study aims to evaluate the impact of simulation-based team training on sick leave among healthcare professionals. Using a controlled study design and systematic measures of training exposure, our study provides new insights into how targeted educational interventions can support workforce well-being and reduce sick leave in healthcare settings.
This trial was registered on ClinicalTrials.gov (NCT06064045) and is part of an established study protocol [33]. It complied with the Transparent Reporting of Evaluations with Nonrandomized Designs (TREND) guidelines [34] and the Key Elements to Report for Simulation-Based Research, according to Cheng et al. [35], as detailed in Appendix 1. The protocol was registered with the Regional Ethics Committee (reference no. 1-16-02-232-22) and under the General Data Protection Regulation at Aarhus University (reference no. 2016-051-000001). In addition, we sought clarification regarding the study’s registration with the Central Denmark Region Committees on Health Research Ethics (reference no. 1-10-72-124-22), which concluded that formal ethical approval was unnecessary for this study.
This multisite controlled intervention follow-up study was conducted from April 2023 to April 2024 across two comparable regions in Denmark, each serving approximately 1.2 million residents. In each region, one university hospital and three regional hospitals participated. Four paediatric departments in one region received the intervention, while four departments in the other region served as controls and received no intervention [36].
Between April 2023 and April 2024, we implemented an initiative targeting approximately 700 doctors and nurses across paediatric departments in the specified region. The primary objective was to enhance staff well-being by improving the quality and increasing the frequency of simulation training.
We developed a logic model (Figure 1) to provide a clear framework for understanding the intervention’s design and intended outcomes [36,37]. This model outlines the inputs, activities, output and expected results, illustrating how the simulation-based training might contribute to reducing sick leave.

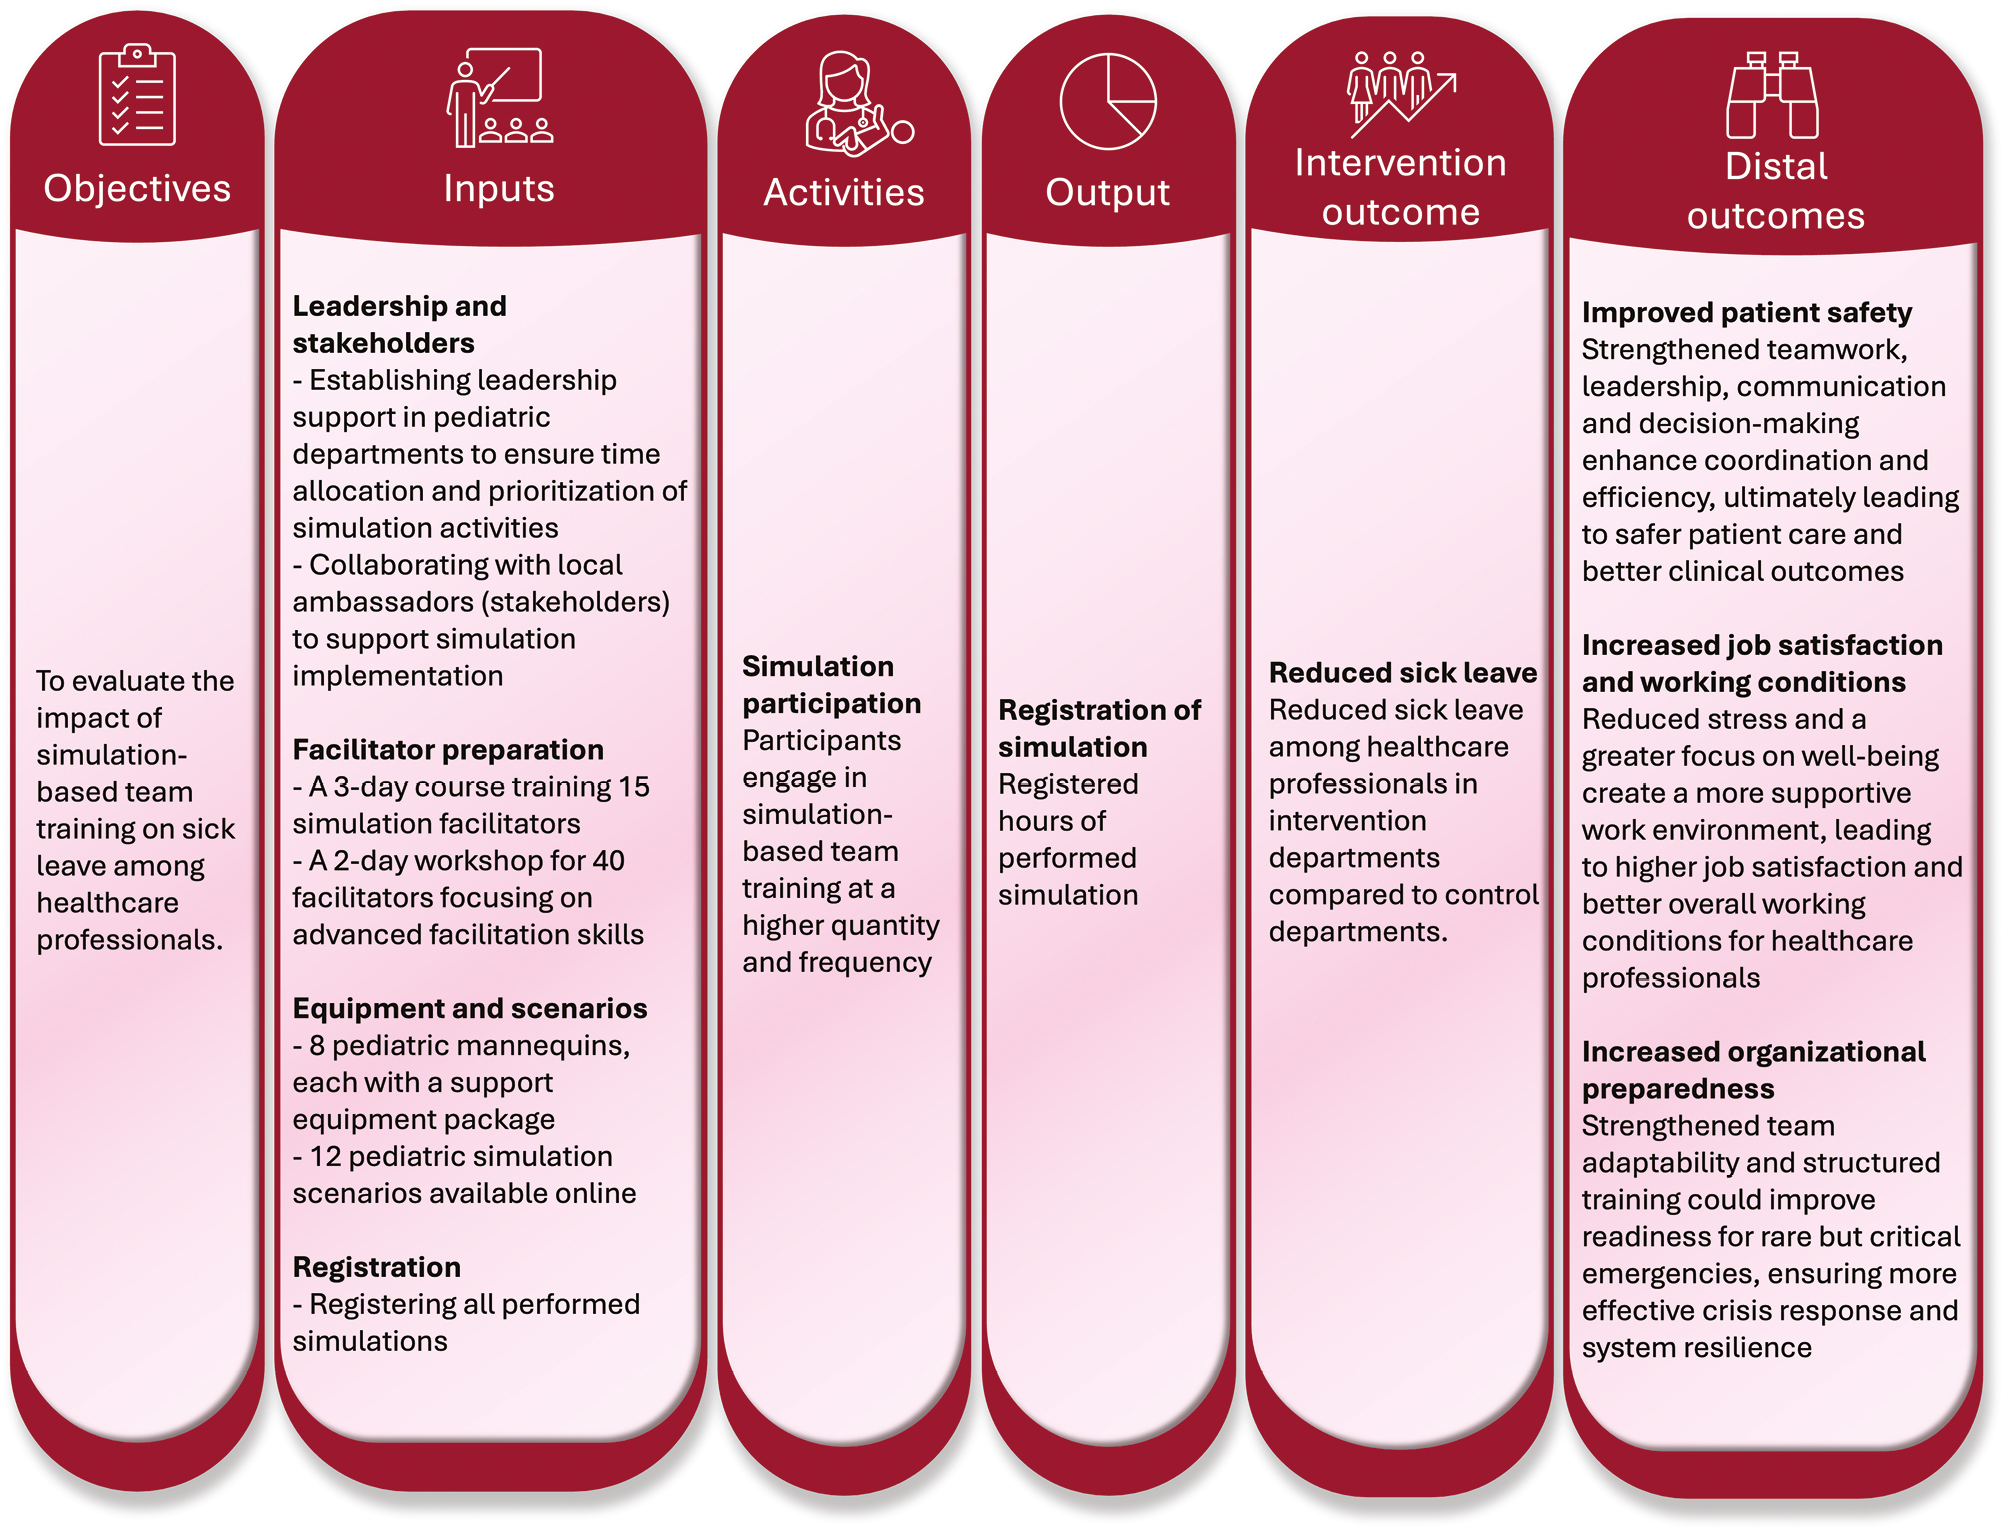
Logic model providing a framework for the intervention’s design and intended outcomes
The simulation-based intervention relied on several key inputs, including facilitator training, equipment, simulation scenarios, structured simulation activity registration, leadership support and local ambassadors. These inputs aimed to enhance the quality and sustainability of simulation activities. Active leadership support was established before the intervention, facilitating data collection, allocating time for simulation activities and prioritizing simulation as a core element of professional education.
A ‘train the trainer’ model was central to the intervention, enabling facilitators to conduct simulation sessions independently within their departments. This approach included a 3-day facilitator training programme in October 2022, which successfully trained 15 new facilitators, increasing the total to 40. The course combined theoretical lessons with practical exercises, focusing on skills such as briefing, scenario management, and debriefing while emphasizing psychological safety as a core element in fostering supportive and trusting environments to reduce stress and burnout among healthcare professionals. Participants explored crisis resource management principles and the TeamGAINS debriefing model, which supports team communication and well-being in high-stress scenarios [38]. Facilitators practised pre-determined scenarios, such as cardiopulmonary resuscitation and anaphylaxis, and self-developed scenarios to ensure consistent skills across departments, promoting effective team communication and leadership as key drivers of cultural change. A more detailed description of the facilitator training programme, including its structure, content and implementation, is provided in Appendix 2.
In March 2023, 27 facilitators participated in a 2-day advanced workshop, bringing together newly trained and experienced facilitators. The workshop emphasized creating psychologically safe learning environments and managing complex debriefing situations while addressing critical paediatric scenarios, such as neonatal resuscitation and respiratory emergencies. Strategies for embedding simulation into departmental routines were also covered, aiming to integrate these practices sustainably into the culture. Facilitators received constructive feedback from experienced colleagues, enhancing their ability to positively influence team dynamics and departmental culture. Additional resources, including pediatric mannequins, software, and an online repository of simulation scenarios, were made available to support the intervention. A more detailed description of the advanced workshop is provided in Appendix 2, while Appendix 3 contains further details on the resources supporting the intervention [36].
Each department appointed a local ambassador to coordinate simulation activities, ensuring alignment with departmental goals and fostering staff engagement. The registration process, conducted from January 2023 to April 2024, systematically documented participant details, individual tasks, affiliations, session dates, durations and learning objectives. Scenarios focused on reinforcing critical competencies such as teamwork, communication, leadership and decision-making in high-risk paediatric contexts, often addressing multiple objectives within a single session. Local ambassadors facilitated this process across intervention and control groups, receiving regular updates on registered simulation sessions every 3 weeks. This approach helped identify and address any simulation sessions that may have been mistakenly omitted from the registration system, ensuring complete and consistent registration across both regions.
Data on sick leave and sociodemographic characteristics were available from two ongoing administrative Human Resource databases, covering all employment-related information in the intervention and control regions [39]. To ensure consistency across the two datasets, the data extraction and preparation process was conducted in close collaboration with the business intelligence specialists from each region. These specialists are business intelligence professionals responsible for developing and maintaining data systems that enable healthcare organizations to use data for informed decision-making [40]. They work closely with clinical and administrative staff to transform complicated data into accessible information. The collaboration included joint discussions to align definitions and procedures, informed by several consultations, particularly with the developer from the intervention region, who brought extensive expertise in Danish sick leave registration and relevant legal provisions. This process ensured alignment regarding population definitions, sick leave metrics and inclusion criteria, which included that:
•Sick leave rates were calculated similarly by dividing each employee’s sick leave hours by their employed hours and multiplying by 100, accounting for part-time work and employment changes.
•Population definitions excluded groups, such as medical students without standard contracts, in both regions.
•Sick leave categories were harmonized to include registered sick leave and partial sick leave due to illness, while excluding other types of leave, such as maternity or parental leave.
Two analyses of sick leave data were conducted, covering the pre-intervention period (April 2021 to April 2023) and the intervention period (April 2023 to April 2024). One analysis compared sick leave over the 2 years preceding the intervention with the intervention year, while the other focused on sick leave during the year immediately preceding the intervention compared to the intervention year. Data before 2021 were excluded due to the impact of the COVID-19 pandemic.
Sociodemographic characteristics included gender, age, profession and workplace (hospital and department). The final sample included 2,164 employees. Those employed in both regions during the study period were excluded to avoid crossover effects. To reflect meaningful workplace engagement and intervention exposure, two exclusions were applied: (1) employees with a sick leave rate above 65% in either period (n = 22), as this indicates substantial absence likely due to serious illness, and (2) employees contracted for fewer than 100 annual hours (n = 58).
The statistical analysis focused on two critical comparisons: (1) changes in sick leave rates over time within each group and (2) differences in changes between the two groups over time (difference-in-differences). Each employee was included only once in the dataset, regardless of the number of simulation sessions they attended, ensuring independence of observations. The mean and standard deviation (SD) for sick leave were calculated at specific time points to describe the distribution and variability of sick leave rates. Sick leave rates were additionally converted into hours to provide a tangible measure of the intervention’s impact on available working hours. This conversion was based on the average annual working hours for healthcare professionals in Denmark, estimated at 1,412 hours per person per year. The difference in sick leave rates was multiplied by the average annual working hours to estimate the number of working hours saved per person.
Non-paired t-tests were used for all employees to analyse differences across time periods. In contrast, an additional non-paired t-test analysis was conducted to assess changes in sick leave over time between the groups (difference-in-differences). Additionally, mixed-effects regression analyses were conducted to adjust for age group, profession and gender. We conducted a secondary analysis focusing on sick leave rates among complete case group employees, defined as those continuously employed throughout the 3-year study period from April 2021 to April 2024. Paired t-tests were used to evaluate changes in sick leave rates over time in the complete case group.
Hedges’ g estimate was calculated for statistically significant values within the difference-in-differences analysis to estimate the effect sizes. The normality assumption was assessed using histograms and qnorm plots to illustrate data distribution. Simultaneously, the homogeneity of variance was assessed using Levene’s test for equality of variances, and box plots were used for visualizing the data. The parallel trends assumption for the difference-in-differences analysis was tested by comparing pre-intervention changes in sick leave rates between groups from 2021–2022 to 2022–2023 (Appendix 4).
All tests were two-sided, and a p-value of less than 0.05 was considered statistically significant. Statistical analyses were conducted using Stata version 18.
Table 1 summarizes the baseline characteristics of the intervention and control groups. The study included 2,164 individuals. Baseline characteristics were comparable across groups, with most employees being female (89% in the intervention group, 88% in the control group) and nurses (66% and 59%, respectively). Age distribution was also similar across groups.

| Variable | Intervention group, n = 1,172 (%) | Control group, n = 992 (%) | Total, n = 2,164 (%) |
|---|---|---|---|
| Gender | |||
| Female | 1,039 (89) | 871 (88) | 1,910 (88) |
| Male | 133 (11) | 121 (12) | 254 (12) |
| Profession | |||
| Nurses | 779 (66) | 589 (59) | 1368 (63) |
| Doctor | 393 (34) | 403 (41) | 796 (37) |
| Age (years) | |||
| <30 | 128 (11) | 142 (14) | 270 (12) |
| 30–39 | 554 (47) | 436 (44) | 990 (46) |
| 40–49 | 241 (21) | 189 (19) | 430 (20) |
| 50–59 | 150 (13) | 131 (13) | 281 (13) |
| >59 | 99 (8) | 94 (9) | 193 (9) |
As shown in Table 2, simulation session characteristics were registered starting 3 months prior to the intervention and continued throughout the intervention period. During the pre-intervention phase (January 2023 to April 2023), 27 simulation sessions were recorded in the intervention group compared to 22 in the control group. During the intervention period (April 2023 to April 2024), activity increased significantly in the intervention group, with 244 simulation sessions recorded compared to 84 sessions in the control group, yielding a ratio of 2.9.
| Variable | Intervention | Control | Total |
|---|---|---|---|
| group | group | ||
| Session engagement and duration metrics | |||
| Simulation sessions prior to intervention: n | 27 | 22 | 49 |
| Simulation sessions during intervention: n | 244 | 84 | 328 |
| Facilitators in simulation sessions: Mean (min: max) | 1.8 (1: 4) | 2.1 (1: 4) | 1.9 (1: 4) |
| Participants in simulation sessions: Mean (min: max) | 5.6 (1: 12) | 5.3 (1: 12) | 5.5 (1: 12) |
| Briefing minutes: Mean (min: max) | 13.7 (2: 30) | 11.0 (2: 30) | 13.2 (2: 30) |
| Scenario minutes: Mean (min: max) | 22.8 (5: 45) | 21.2 (5: 45) | 22.4 (5: 45) |
| Debriefing minutes: Mean (min: max) | 31.1 (10: 60) | 26.6 (10: 60) | 30.1 (10: 60) |
| Total hours of simulation: n | 1,993 | 533 | 2,526 |
| Simulation scenarios | n (%) | n (%) | n (%) |
| Non-neonatal scenarios | |||
| Circulatory emergencies | 82 (40) | 43 (47) | 125 (42) |
| Respiratory decompensation | 32 (16) | 12 (13) | 44 (15) |
| Severe infection | 25 (12) | 9 (10) | 34 (11) |
| Status epilepticus | 27 (13) | 7 (8) | 34 (11) |
| Sepsis | 14 (7) | 6 (7) | 20 (7) |
| Morbus Cordis | 10 (4) | 2 (2) | 12 (3) |
| Trauma and injury | 11 (5) | 0 (0) | 11 (4) |
| Metabolic and endocrine disease | 7 (3) | 1 (1) | 8 (3) |
| Other1 | 8 (4) | 13 (14) | 21 (7) |
| Neonatal scenarios | |||
| Respiratory decompensation: n (%) | 24 (28) | 4 (24) | 28 (27) |
| Pre-term stabilization: n (%) | 15 (17) | 4 (24) | 19 (6) |
| Acute metabolic issues: n (%) | 15 (17) | 0 (0) | 15 (14) |
| Cardiovascular instability: n (%) | 11 (13) | 3 (18) | 14 (14) |
| Congenital heart diseases: n (%) | 10 (11) | 2 (12) | 12 (12) |
| Resuscitation: n (%) | 10 (11) | 0 (0) | 10 (10) |
| Combined asphyxia/cooling/seizure: n (%) | 2 (2) | 4 (24) | 6 (6) |
| Learning objectives | n (%) | n (%) | n (%) |
| Non-technical learning objectives | |||
| Leadership: n (%) | 193 (37) | 4 (3) | 197 (30) |
| Communication and information handover: n (%) | 137 (26) | 12 (8) | 159 (24) |
| Closed-loop feedback: n (%) | 113 (21) | 20 (16) | 133 (20) |
| Teamwork: n (%) | 62 (12) | 47 (38) | 109 (17) |
| ABCDE2 and role clarity: n (%) | 19 (4) | 30 (24) | 49 (8) |
| Decision-making and prioritization: n (%) | 4 (1) | 1 (1) | 5 (1) |
| Technical learning objectives | |||
| Emergency care algorithms: n (%) | 78 (43) | 16 (46) | 94 (44) |
| Advanced life support: n (%) | 22 (12) | 13 (37) | 35 (16) |
| Infection control and management: n (%) | 21 (12) | 1 (3) | 22 (10) |
| Pharmacology and drug administration: n (%) | 17 (9) | 4 (11) | 21 (10) |
| Airway management: n (%) | 21 (12) | 0 (0) | 21 (10) |
| Neonatal resuscitation: n (%) | 12 (7) | 0 (0) | 12 (6) |
| Handling technical equipment: n (%) | 10 (6) | 1 (3) | 11 (5) |
1 Scenarios that fall outside the specified categories.
2 ABCDE: Airway, Breathing, Circulation, Disability, and Exposure.
Both groups had similar numbers of facilitators and employees and comparable durations for the briefing, scenario and debriefing phases. The intervention group predominantly focused on scenarios addressing neonatal and paediatric emergencies, such as respiratory and circulatory issues in neonates, while the control group placed greater emphasis on cardiac emergencies. Regarding learning objectives, the intervention group prioritized leadership, communication and closed-loop feedback, whereas the control group focused more on teamwork and the ABCDE approach with clearly defined roles.
The adjusted analysis shows that sick leave rates in the intervention group declined more substantially than in the control group over the three periods (Table 3). In the control group, sick leave rates remained stable, with only a minor increase from the 2-year period before the intervention (3.9%) to the intervention period (3.8%), corresponding to an adjusted difference of 0.0 (95% confidence interval [CI]: −0.5 to 0.6). A slight increase was observed when comparing the 1-year period before the intervention (3.4%) to the intervention period (3.8%), with an adjusted difference of 0.5 (95% CI: −0.1 to 1.0).
| Sick leave rate: % (SD) | Difference: % (CI 95) | |||||||||
|---|---|---|---|---|---|---|---|---|---|---|
| N | 2 years before intervention1 | N | 1 year before intervention2 | N | Intervention period3 | Difference (Intervention – 2-year pre-period) | Difference (Intervention – 1-year pre-period) | |||
| Crude | Adjusted4 | Crude | Adjusted4 | |||||||
| Control group | 862 | 3.9 (7.3) | 715 | 3.4 (5.7) | 686 | 3.8 (7.3) | −0.1 | 0.0 (−0.5 to 0.6) | 0.4 | 0.5 (−0.1 to 1.0) |
| Intervention group | 1,029 | 5.8 (8.5) | 858 | 4.9 (7.9) | 834 | 4.5 (7.2) | −1.3 | −1.0* (−1.5 to −0.4) | −0.5 | −0.4 (−1.0 to 0.2) |
| Difference in difference5 | −1.2* | −1.0* (−1.8 to −0.2) | −0.8 | −0.8* (−1.7 to −0.0) | ||||||
Notes: Non-paired t-tests were used. * indicates a statistically significant difference (p < 0.05).
1 Period 1: April 2022–April 2023.
2 Period 2: April 2021–April 2023.
3 Period 3: April 2023–April 2024.
4 Estimates from mixed-effects linear models, adjusted for age group, profession and gender.
5 Estimate from a single difference-in-differences mixed-effects model, comparing changes over time between the two groups.
In contrast, the intervention group experienced a greater reduction in sick leave rates than the control group. The adjusted difference between the 2-year period before the intervention (5.8%) and the intervention period (4.5%) was −1.0 (95% CI: −1.5 to −0.4), indicating a significant decrease. Similarly, the adjusted difference between the 1-year period before the intervention (4.9%) and the intervention period (4.5%) was −0.4 (95% CI: −1.0 to 0.2).
The difference-in-difference analysis further highlights a statistically significant reduction in the intervention group compared to the control group. The difference-in-difference estimate was −1.0 (95% CI: −1.8 to −0.2) when comparing the 2-year pre-intervention period to the intervention period (Hedges’ g = −0.12) and −0.8 (95% CI: −1.7 to −0.0) when comparing the 1-year pre-intervention period to the intervention period (Hedges’ g = −0.12).
A reduction of 1.0% corresponds to an additional 16.94 working hours per person over 1 year. For the 700 healthcare professionals employed in the intervention group during the 1-year intervention period, this equates to 11,858 working hours.
Again, the adjusted analysis shows that sick leave rates in the intervention group declined more substantially than in the control group over the three periods (Table 4). In the control group, sick leave rates remained unchanged when comparing the 2-year period before the intervention (4.1%) to the intervention period (4.1%), with an adjusted difference of 0.2 (95% CI: −0.4 to 0.8). An increase was observed when comparing the 1-year period before the intervention (3.5%) to the intervention period (4.1%), with an adjusted difference of 0.7 (95% CI: 0.0 to 1.3).
| Sick leave rate: % (SD) | Difference: % (CI95) | |||||||||
|---|---|---|---|---|---|---|---|---|---|---|
| N | 2 years before intervention1 | N | 1 year before intervention2 | N | Intervention period3 | Difference (Intervention – 2-year pre-period) | Difference (Intervention – 1-year pre-period) | |||
| Crude | Adjusted4 | Crude | Adjusted4 | |||||||
| Control group | 556 | 4.1 (7.9) | 556 | 3.5 (5.5) | 556 | 4.1 (7.9) | 0.1 | 0.2 (−0.4 to 0.8) | 0.7 | 0.7* (0.0 to 1.3) |
| Intervention group | 685 | 5.9 (8.0) | 685 | 4.8 (7.4) | 685 | 4.6 (7.2) | −1.3 | −0.9* (−1.4 to −0.3) | −0.2 | −0.2 (−0.8 to 0.4) |
| Difference in difference5 | −1.4* | −1.1* (−1.9 to −0.2) | −0.9 | −0.9* (−1.8 to −0.0) | ||||||
Notes: Paired t-tests were used. * indicates a statistically significant difference (p < 0.05).
1 Period 1: April 2022–April 2023.
2 Period 2: April 2021–April 2023.
3 Period 3: April 2023–April 2024.
4 Estimates from mixed-effects linear models, adjusted for age group, profession and gender.
5 Estimate from a single difference-in-differences mixed-effects model, comparing changes over time between the two groups.
Conversely, the intervention group showed a more substantial reduction in sick leave rates. The adjusted difference between the 2-year pre-intervention period (5.9%) and the intervention period (4.6%) was −0.9 (95% CI: −1.4 to −0.3), reflecting a statistically significant decrease. For the 1-year pre-intervention period (4.8%) compared to the intervention period, the adjusted difference was −0.2 (95% CI: −0.8 to 0.4), indicating no statistically significant change.
The difference-in-difference analysis revealed a statistically significant reduction in sick leave rates for the intervention group compared to the control group. The adjusted difference-in-difference estimate was −1.1 (95% CI: −1.9 to −0.2) for the 2-year pre-intervention period versus the intervention period (Hedges’ g = −0.17) and −0.9 (95% CI: −1.8 to −0.0) for the 1-year pre-intervention period versus the intervention period (Hedges’ g = −0.16).
All assumption checks indicated that the data met the necessary criteria for the t-test analyses. The distributions of change in sick leave from pre- to during intervention in both the intervention and control groups were normally distributed, as confirmed by Q–Q plots and histograms. Levene’s test showed no significant difference (p < 0.05) in variances between the groups, and box plots supported these findings. The parallel trends assumption for the difference-in-differences analysis was also supported, with no significant pre-intervention difference between groups (mean difference −0.70 percentage points, p = 0.18). Thus, normality and variance homogeneity, as well as parallel trends assumptions, were met, as illustrated in Appendix 4.
Our results demonstrate a significant reduction in sick leave rates over time in the intervention group compared to the control group, as indicated by the difference-in-difference estimates.
For all employees (Table 3), the adjusted difference-in-difference estimate was −1.0% (95% CI: −1.8 to −0.2) when comparing the 2-year pre-intervention period to the intervention period and −0.8% (95% CI: −1.7 to −0.0) for the 1-year pre-intervention period. A similar pattern was observed in the complete stable group analysis (Table 4). Thus, both analyses consistently showed reductions in sick leave rates over time in the intervention group compared to the control group.
However, in the control group, sick leave increased from the pre-intervention to the intervention period, with a significant rise in the stable group analysis. This suggests that the intervention effect may reflect a stabilization in the intervention group rather than an absolute reduction in the outcome.
The parallel trends assumption was supported (mean difference: −0.70 percentage points, p = 0.18). Yet, the larger numerical decline in the intervention group before the intervention suggests part of the observed effect might reflect a pre-existing downward trend rather than a true intervention effect. This should be taken into account when interpreting the results.
The adjusted analyses indicated very small Hedges’ g effect sizes, yet the practical implications of the findings may be meaningful. As presented in the results, a modest 1.0% reduction in sick leave was estimated to correspond to nearly 11,858 additional working hours for the intervention group over 1 year. When compared to the 1,993 hours spent on simulation training, this suggests a potential return on investment, with approximately 5.9 working hours gained for every hour spent on training. These findings underscore the potential for simulation-based interventions to deliver meaningful organizational benefits that immediately impact individual outcomes. Beyond benefits from working hours, reductions in sick leave may have broader implications for healthcare delivery. Staff shortages and absenteeism, often linked to burnout, have increased the risk of medical errors and negatively impacted patient outcomes [41]. Simulation-based training interventions may support staff well-being and enhance patient care quality by stabilizing sick leave rates.
Limited research has investigated simulation-based training and its potential to influence sick leave rates [20,31]. This study contributes to the field by providing large-scale, controlled data with detailed training frequency and content documentation. We offer valuable insights into how simulation-based training can be effectively implemented to support staff well-being and reduce sick leave rates. Our findings reinforce this notion. We found a notable difference over time, with decreasing sick leave rates in the intervention group while they remained constant or increased in the control group. This difference suggests that while simulation-based training may reduce the rate of sick leave, the degree of impact may vary based on initial conditions and contextual factors unique to each setting.
In line with previous studies, simulation-based training may enhance healthcare professionals’ self-efficacy, which could contribute to the observed reductions in sick leave [42,43]. Self-efficacy, characterized by the belief in one’s ability to handle challenging situations, is a key predictor of stress management and job performance [14,15]. By fostering a sense of competence and confidence, simulation may help staff feel more capable of managing work-related stressful situations, reducing burnout, and potentially decreasing sick leave rates. Although our study did not directly measure changes in self-efficacy, it is plausible that the teamwork and stress management improvements resulting from the simulation contributed to a greater sense of control and confidence, leading to better overall well-being.
While our findings align with existing research on the benefits of simulation-based training, they also raise questions about the timing and sustainability of these effects [20,31]. Cultural shifts resulting from simulation training may require more time to manifest than allowed by our 1-year intervention period. Unlike the studies by Meurling et al. and Schram et al., which included extended follow-up periods to assess the training’s long-term impact, our study focused only on the intervention year [20,31].
We did not measure sick leave beyond the intervention period, as the control group began implementing similar interventions, potentially confounding the results. Furthermore, contextual factors such as organizational priorities, resource availability and leadership support may have influenced the implementation of simulation training and sick leave rates after the intervention.
Compared to our earlier study (Schram et al.), this analysis included detailed registration of simulation sessions and a more structured and frequent training programme, providing a stronger measure of exposure and enabling a clearer assessment of its potential impact on sick leave [20].
A strength is the transparent and predefined design. The study is described in a published protocol [33], which was made available prior to the completion of data collection, and the project was preregistered at ClinicalTrials.gov. This enhanced methodological transparency is achieved by clarifying in advance which data would be collected and how the analyses would be conducted.
Another primary strength is its robust multisite controlled intervention design, which facilitates meaningful comparisons over time between intervention and control groups across distinct yet comparable healthcare regions [44]. This design enhances the generalizability of findings to similar hospital settings, particularly pediatric care. The large sample size of 2,164 healthcare professionals contributed to the reliability of the results and the study’s capacity to detect differences in sick leave rates between groups.
The study also benefited from a comprehensive data collection approach, including detailed tracking of sick leave rates and sociodemographic characteristics through administrative health resource databases. This ensured accurate outcome measurements. Furthermore, the precise registration of simulation participation provided granular data on exposure to the intervention.
The study’s inclusion of two distinct pre-intervention periods is a particular strength. By comparing a 1-year and 2-year baseline to the intervention period, the analysis allows for a more nuanced understanding of trends over time. This approach reduces the risk of bias from short-term fluctuations in sick leave rates and provides a stronger foundation for evaluating the intervention’s effect.
Despite the controlled design, the study’s non-randomized nature introduces the possibility of selection bias [45]. While baseline characteristics were generally comparable and adjusted for, unmeasured differences, such as workplace culture, baseline stress levels, workload intensity, prior training exposure, leadership styles and resource access, may have influenced outcomes [4,6,9,46–48]. Additionally, the intervention group had a higher baseline sick leave rate than the control group, complicating the interpretation of the intervention’s effect. Table 3 shows that baseline sick leave rates in the intervention group were 5.8% and 4.9%, 2 and 1 year before the intervention, respectively, compared to 3.9% and 3.4% in the control group, and to 4.4% which is the Danish mean for public hospital employees [49]. This baseline difference indicates that the regions may not be fully comparable, despite similarities in hospital size, staffing and services. Although the difference-in-differences analysis was adjusted for baseline differences and time trends, unobserved contextual factors may have contributed to the baseline differences, and residual confounding remains a possibility. Regression towards the mean may also explain part of the observed effect, as groups with above-mean baseline values may tend to decline naturally over time.
While local ambassadors reported similar changes across intervention and control groups, these factors needed to be systematically measured, making it challenging to fully account for their impact. These issues highlight the complexities of evaluating the intervention’s outcomes in a dynamic healthcare environment. Nonetheless, the sick leave effects of simulation-based team training are assumed to be generalizable across specialties [20].
Moreover, sick leave may be influenced by many contextual and time-dependent factors unrelated to the intervention, such as seasonal illnesses, political decisions, management changes and organizational restructuring. Although no systematic data were captured to document these influences, local ambassadors reported such changes in both regions, which might have caused unmeasured confounding. Their distribution across groups is unknown, but for meaningful interpretation, external influences such as seasonal illnesses should have been roughly equal when comparing identical calendar periods. Therefore, the results should be viewed as associations rather than definitive causal effects.
The primary analysis included all employees, regardless of their employment stability over the 3 years, to provide a broad perspective on the intervention’s impact. However, this approach introduced variability, as employees with shorter employment durations may not have been equally exposed to the intervention or its long-term effects. To enhance the reliability of the analysis by focusing on employees with sufficient exposure to the intervention, we excluded 22 individuals whose sick leave rates exceeded 65% during either the pre-intervention period (April 2021 to April 2023) or the intervention period (April 2023 to April 2024). These high sick leave rates likely precluded engagement with the intervention and were driven by underlying causes, such as chronic somatic illness, that the intervention would not address. Additionally, we excluded employees working less than 100 hours annually to minimize bias from short-term or temporary employment, removing 58 individuals.
The complete case group analysis, focusing on employees employed continuously over the 3 years, allowed for a more precise evaluation of sustained effects. This approach reduced noise from factors such as turnover and ensured similar exposure to the intervention among individuals. However, it introduced selection bias by excluding employees who may have left due to poor health or other reasons, limiting the generalizability of findings to the broader workforce. Together, these analyses provided complementary insights, balancing comprehensiveness and precision.
Additionally, the study could not differentiate between types of sick leave, such as short-term absences for minor illnesses, versus long-term leaves for chronic conditions or surgery recovery. This limitation means that some fluctuations in sick leave rates may not directly relate to the intervention. However, the assumption of similar sick leave patterns across the two Danish healthcare regions minimizes the risk of bias, as both groups were subject to comparable working conditions, demographics and policies.
This study suggests that simulation-based team training may help reduce sick leave rates among healthcare professionals, with the difference-in-differences analysis indicating a potential effect. These findings highlight the role of simulation-based training in supporting staff attendance and suggest that it could contribute to more sustainable healthcare systems if integrated into organizational strategies and policy-level initiatives. However, the mechanisms underlying this effect remain to be explored. Future research should examine how simulation-based training can influence sick leave to optimize its implementation and maximize benefits for both healthcare professionals and organizations.
We thank the paediatric department management and staff for participating in this project. Special thanks to Neel Toxvig, Magnus Bie, Mette Høy and Anette Skaarup from Corporate HR, MidtSim, Central Denmark Region, for facilitating the 3-day facilitator course and a 2-day workshop and maintaining equipment. We also wish to acknowledge the Head of Office at Corporate HR, MidtSim, Central Denmark Region, for their support.
All authors were involved in the study’s conception and design. The corresponding author took the lead in drafting the manuscript. All authors reviewed the content critically and approved the final version.
Grants from the Elsass Foundation and the Central Denmark Region supported this project. However, the funding sources did not influence the study design, data collection, analysis, interpretation, manuscript drafting, or scientific conclusions. The Elsass Foundation funded A. Schram’s salary, while the Central Denmark Region covered the costs of A. Schram’s salary, simulation equipment, and the simulation facilitator course and workshop.
The data supporting this study’s findings are available from the corresponding author upon reasonable request.
None declared.
None declared.
1.
2.
3.
4.
5.
6.
7.
8.
9.
10.
11.
12.
13.
14.
15.
16.
17.
18.
19.
20.
21.
22.
23.
24.
25.
26.
27.
28.
29.
30.
31.
32.
33.
34.
35.
36.
37.
38.
39.
40.
41.
42.
43.
44.
45.
46.
47.
48.
49.
 Effect of simulation-based team training on sick leave among healthcare professionals: a multisite controlled follow-up study
 Facebook
 Twitter
 Linkedin
 Whatsapp
